
Leg 185 Logging Summary
Shipboard Scientific Party
Introduction
The primary objectives of ODP Leg 185 were to characterize the sediment and crustal input fluxes into the arc-trench subduction systems of the Mariana trench (Site 801) and the Izu-Bonin trench (site 1149). Despite very similar settings and the same subducting plate, there are significant geochemical differences between the two volcanic arc compositions. Characterizing the integrated inputs in the two trenches should determine if the observed differences in the volcanics result from different input materials or different processes in the "subduction factory". This report presents the preliminary results of the logging operations at the two sites visited during this leg.
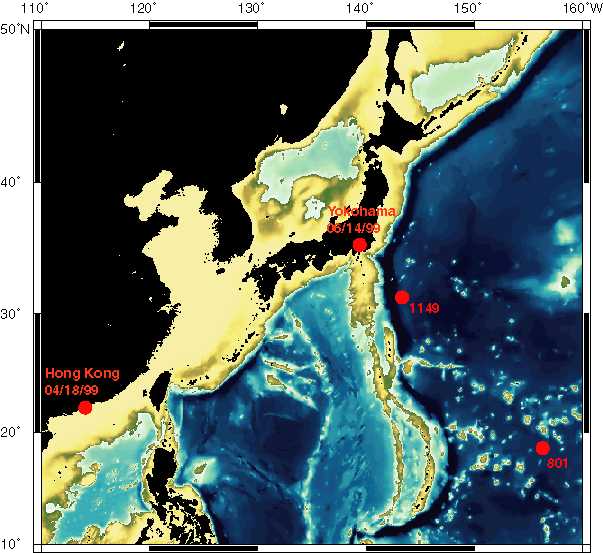
Figure 1: ODP Leg 185 sites and the Izu-Mariana margin
Logging operations overview
Because of the primary geochemical objectives of the leg, the Geochemical Logging Tool (GLT) was planned to be deployed at the two sites in addition to the standard suite of tools: Triple Combo (Natural Gamma Ray/Density/Porosity/Resistivity) and FMS/Sonic. Due to logistic delays, the GLT was not available at Site 801, where it had been previously used during Leg 144 through the entire sediments section. In addition, a malfunction of the Dipole Sonic Imager (DSI) at both sites required the use of the Long Spacing Sonic. This tool does not allow for a multi-modes full waveform analysis provided by the DSI, but it has proven the most consistently reliable sonic tool in the very diverse ODP settings. Despite these changes to the original logging plan, the highly successful drilling program and the generally good hole conditions allowed the collection of a unique set of in situ logging data to characterize the inputs into the Izu-Mariana subduction system.
Results
Site 801 : A Jurassic basement reference site
Following the previous achievements of Legs 129 and 144, the objective of Leg 185 in Hole 801C were to the sample the upper oxidative zone of alteration and possibly the entire extrusive layer of this oldest sampled in situ oceanic crust. The maximum depth reached during Leg 185 was 926 m or ~450 m into basement, still in the extrusives.
Lithology characterization
The good hole conditions (see caliper log in Figure 2) allowed us to acquire high quality data over ~350 m of basement in Hole 801C. An obstruction or a 70-80-m-thick fill prevented all logging runs from reaching the bottom of the hole and characterizing the formations cored below ~850 mbsf. The combined analysis of the logging data shows an excellent agreement with the lithologic and structural observations made on cores. In particular, the main lithological division identified in the samples can be associated with distinct downhole characteristics in chemical composition (Figure 2) and physical properties (Figure 3). Because of the high electrical resistivity of the basalts already measured during Leg 144, the Dual Laterolog (DLL) was used in the Triple Combo instead of the DITE to measure the resistivity in this hole.
|
|
|
|
Figure 2: Caliper and Radioactive elements concentration measured by the Natural Gamma Ray tools. |
Figure 3: Principal geophysical logs acquired in Hole 801C. Caliper and Gamma Ray are shown for correlation. |
The Alkalic Basalt (above ~510 mbsf), Upper Hydrothermal (~510-525 mbsf) and Upper Massive Flow (tholeitic basalts 525-590 mbsf) units were recovered during Leg 129 and logged during Leg 144. They are characterized by highest recorded gamma ray values and K, U and Th contents in the alkaline basalt, enlarged hole and low resistivity in the Upper Hydrothermal unit, and high resistivity, density and sonic velocity with a high Thorium in the Upper Massive flows. The high Thorium is difficult to explain because it contradicts the results of chemical analysis on samples collected in the same unit showing more typical of MORB low thorium content.
The Upper Pillows and Thin Flows (590-720 mbsf) display a high variability in both compositional (Figure 2) and physical (Figure 3) parameters, reflecting the succession of pillows, thin flows and abundant inter-pillow sediments. Within this unit, a thin low temperature Lower Hydrothermal Unit at ~630 mbsf is similar to the upper hydrothermal unit and made of sediments cemented by the precipitation of iron and silica from low temperature hydrothermal fluids. It is indicated in the logs by a peak in Gamma Ray and Uranium, a small enlargement the caliper and lower density, resistivity and Vp values. Below this hydrothermal unit, Pillows become dominant with clear inter-pillow horizons (630-720 mbsf), generating a higher rugosity of the borehole and a higher frequency variability in density and sonic velocity. The lower amount of inter-pillow sediments is indicated by the low gamma ray and K, U, Th measurements.
Below 720 mbsf, the Lower Massive Flows unit is characterized by a very regular borehole and less variable density and sonic velocity. Some of the massive flows can be up to 12 m thick, indicated by intervals with high resistivity, high density and velocity, such as 740-752 mbsf, 757-767 mbsf or 810-820 mbsf.
The deepest unit logged (840-850 mbsf) is composed of Breccias and has been interpreted as tectonic and possibly fault-related because of its thickness. Due to its location at the bottom of the tool string, only the resistivity probe actually recorded data in this interval, indicating a slight increase in resistivity. The obstruction encountered by the logging probes below 850 mbsf could have been be due to brecciated material.
Magnetic field measurements
Downhole magnetic field measurements (Figure 4) were made with a three-axis fluxgate magnetometer of the General Purpose Inclinometry Tool (GPIT) that is used to orient the FMS images. Between 500 and 550 mbsf, the measured horizontal and vertical component are remarkably uniform. The horizontal component is almost equal to the local magnetic field at this date and location (from the NGDC). The vertical component is about 2900 nT higher than the local field, which might result from the influence of the sonic probe above the GPIT and of the wireline. Such uniformity in the measured field indicates the low magnetization of the rocks. Below 550 mbsf, the fluctuations of the measured field indicate a stronger magnetization of the formation, creating anomalies on the order of 10,000 nT. The overall alternance of polarity of the anomalies along the hole can explain the low surface magnetic anomaly characteristic of the "Jurassic Quiet Zone". For the majority of the borehole, the horizontal and vertical components of magnetic intensity are generally in phase and exhibit similar patterns. In three regions, however, the vertical and horizontal components appear to be out of phase (640-670 mbsf, 710-745 mbsf, and 760-780 mbsf). The in-phase relations suggest original magnetization in the Southern Hemisphere during the Middle Jurassic, while the out-of-phase relations suggest subsequent remagnetization in the Northern Hemisphere during the Cretaceous. Additional detailed analysis and measurements are required to verify and quantify these initial, tentative observations.
Figure 4: Three component magnetic field measured with
the GPIT
FMS electrical images
The Formation Microscanner (FMS) electrical images were used in combination with the other data for this correlation with the lithological observations and for the precise delineation of individual units. They were also crucial for the characterization of the multiple veins present in the highly altered basalts of the Upper pillows and flows and Upper massive flows units. Figures 5a and b shows examples of the vein networks (Dark conductive features) that were partially recovered in the cores of these units.
|
|
|
|
Figure 5a: FMS image 599-605 mbsf: |
Figure 5b: FMS Image 666-673 mbsf. |
Temperature log
The temperature log recorded with the TAP tool attached at the bottom of the triple combo identified two areas with strong negative thermal anomalies (Figure 6). These intervals (~510-530 and ~700-720 mbsf) correspond with very low resistivity values and are particularly distinct in the FMS microresistivity images. Such temperature anomalies and lower electrical resistivity indicate that these two intervals are considerably more permeable than the surrounding formations and were invaded by the cold drilling fluid. The lower temperatures are the result of a consequently slower return to thermal equilibrium.
Figure 6: Temperature log and possible hydrothermal conduits
Site 1149: Early Cretaceous Seafloor Subducting at the Izu Bonin Trench
The objectives at Site 1149 were to characterize the entire section of sediments and altered Cretaceous crust entering the Izu-Bonin subduction zone. Because every previous attempt at sampling the Nadezhda basin had failed to recover the ubiquitous thick chert sequence, the logging program was crucial in anticipation of low recovery. The original plan provided for logging both the sediment and the basement sections, but time constraints at the end of the leg did not allow the logging of the basement penetrated in Hole 1149D. The sediment section was successfully logged in Hole 1149B with the triple combo, the geochemical and the FMS/sonic tool strings. Difficult hole conditions in the upper clay-dominated units allowed only the triple combo to be run through the entire section, while the GLT was run in two stages, above 145 mbsf and below ~160 mbsf, and the FMS/Sonic only below ~ 180 mbsf. However while the recovery in the upper section was almost 100% and allowed for a complete characterization from the cores, the primary objective of the logs was accomplished by logging through the entire chert and chalk sequences where recovery was less than 10%.
Lithologic characterization
Despite the very irregular recovery and the difficulties in the upper units, the characteristics of the logs in figure 7 correlate again very well with the lithologic units observed on cores from Holes 1149A/B.
|
|
|
|
|
Figure 7a: Gamma Ray and radioactive elements |
Figure 7b: Geophysical logs (Density, resistivity, sonic velocity) |
Figure 7c: Geochemical logs (Si, Fe, S, H, Cl, Al). |
In Unit I (0-120 mbsf, Ash- and biogenic silica-bearing clay) the caliper indicates an enlarged but smooth hole, relatively steady Gamma Ray counts and K, U, Th amounts and uniformly low resistivity and density values. In both subunits of Units II (Sub-unit IIA, 120-150 mbsf, dark brown pelagic clay with ash layers and IIB, 150-180 mbsf, dark brown pelagic clay without ash layers) the hole is extremely irregular, with a succession of reduced and enlarged intervals generated by the caving in of the loosely (fudgy) formation. The large variability of all the curves in Sub-unit IIA reflects the irregularity of the borehole but also the intercalation of ash layers and overall a lithology less uniform than IIB. This later sub-unit is also marked by high Gamma Ray and K, U, Th amounts. The narrow caliper between 140 and 160 mbsf indicates the place where the impossibility of lowering the GLT required to lower the pipe and limit the following runs to the deeper units.
In Unit III (180-290 mbsf, Interbedded cherts, porcelanite and siliceous clay) the hole is much more regular and the data become of a higher quality, improving even more in the deepest Unit IV. The top of Unit III is marked by a sharp increase in resistivity and density from where both parameters will slowly increase to the bottom of the interval logged. The high but variable level of Silicon (Figure 7c) reflects the presence of interbedded cherts and porcellanite. The highest amounts of silicon (particularly between 180 and 210 mbsf and between 260 and 300 mbsf) correspond to the highest resistivity values, illustrating the resistive properties of the chert layers. The peak in uranium at the bottom of this unit (290-300 mbsf) could be attributed to the presence of organic matter, which could speculatively correlate with similar observations in the Cretaceous Western Thetys.
The top of Unit IV (290-400 mbsf, interbedded radiolarian chert and radiolarian nannofossil marl/chalk) is most apparent in the calcium log (Yellow in Figure 7c), corresponding to the depth where Ca becomes significant because of the presence of chalks/marls. From this depth to the bottom of the hole, Ca increases gradually while most other identified elements (Si, K, U, Th, Al) decrease.
FMS images
The two passes of the FMS in Hole 1149B provided almost complete coverage of Lithologic Units III and IV, where recovery was very poor because of the interbedded cherts and chalks. Figure 8 shows the 'statically normalized' image recorded over most of Units III and IV. While individual chert and chalk layers appear as fine bright subhorizontal features, the generally lighter colors above 300 mbsf indicate the more resistive nature of the sediments in Unit III. Figure 9 shows the entire 'dynamic' image recorded during the first pass. The dynamic normalization underlines the very fine succession of conductive (dark) and resistive (light) layers. The results of the dipmeter analysis of these images is shown with 'tadpoles' indicating the dip and strike of individual features and 'fanplots' indicating the dip azimuth distribution averaged over 20 m intervals. These results seem to indicate a change in the general dipping orientation from N-NE above ~290 mbsf to South below this depth. This transition would coincide with the boundary between Units III and IV. The origin of this structural change is not clear, but post-cruise biostratigraphic studies might provide evidence for a hiatus already suggested by preliminary results. If such a hiatus can be tied with the base of Unit III, it could be associated with some tectonic event that could explain the change in the dipping orientations between the two units.
|
|
|
|
Figure 8: FMS 'static' image recorded across the units III/IV boundary |
Figure 9: FMS analysis in Hole 1149B. 'Fanplots' summarize 'tadpoles' over 20m. |
Logging Summary prepared by:
Gilles Guerin - LDEO